LOCAL WEBSITES
Background Video

Join us in engineering a greener and more sustainable future.

At Vena Energy, we are accelerating the transition to sustainable and affordable renewable energy. We empower over 1,000 employees across 86 offices globally, fostering innovation and excellence in an inclusive workplace. Our business is organised in three verticals – Onshore (Wind and Solar), Offshore Wind, and Energy Storage (stationary and transportable storage).

Onshore solar PV and wind

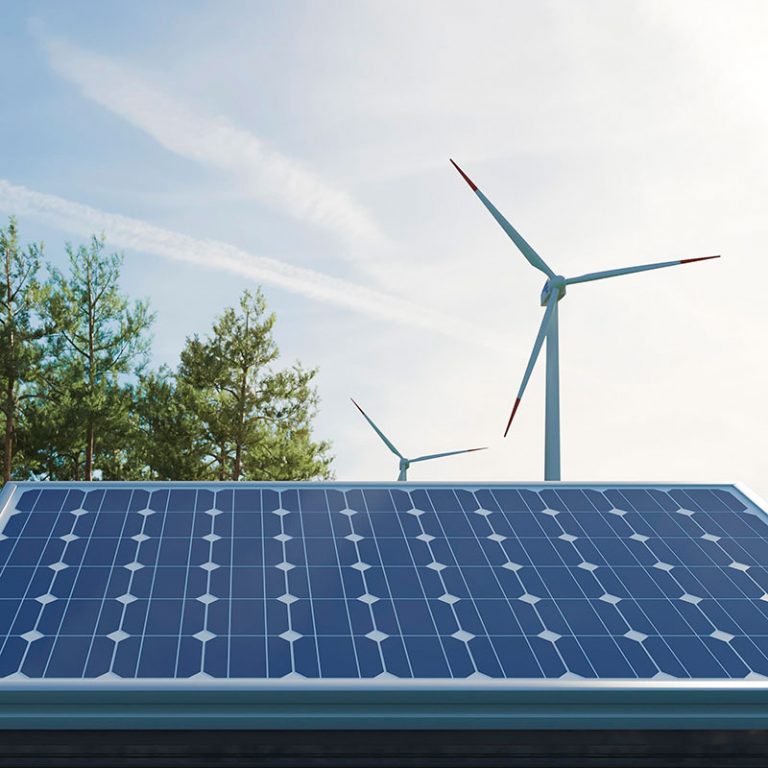
Vena Energy’s onshore renewable energy business encompasses solar PV and onshore wind projects, including hybrid systems. Solar PV converts solar radiation into electricity using the photoelectric effect, while onshore wind projects utilize wind turbines to generate electricity. Both technologies enable the harvesting of clean, renewable energy without fuel consumption or waste discharge, accelerating the transition to sustainable energy. In 2023, Vena Energy contracted an additional 1.6 GW of onshore wind and solar PV projects from our development pipeline, bringing our total contracted capacity to 3.9 GW.

Offshore wind

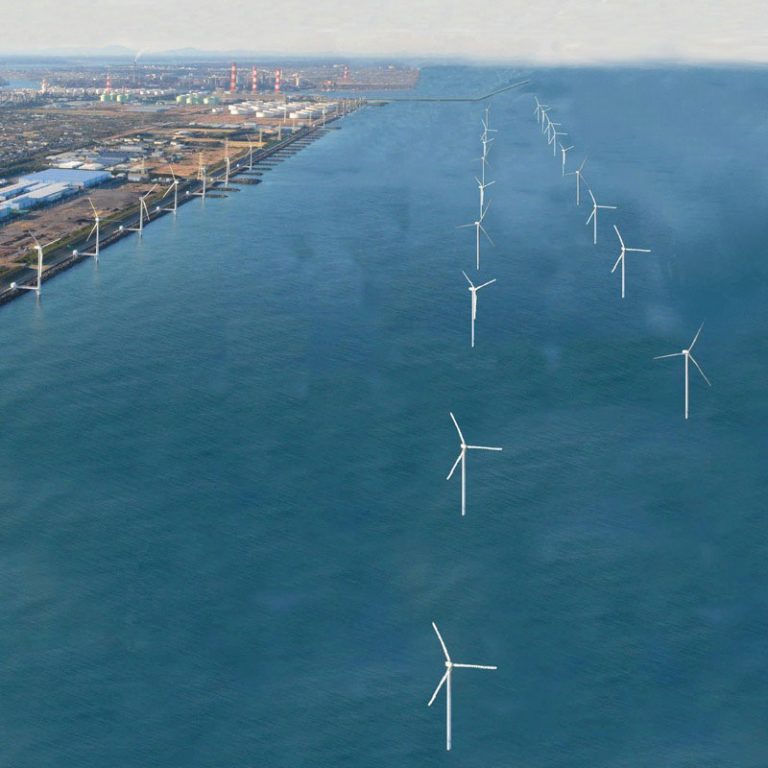
Offshore wind technology harnesses wind energy from turbines situated in the open sea or coastal regions. Offshore wind projects benefit from predictable wind patterns and terrain-free conditions and enhance the potential for electricity generation compared to onshore counterparts. Electricity generated offshore is transmitted via underwater transmission systems, presenting unique challenges including stringent environmental standards and complex logistics. Today, Vena Energy is developing over 19.2 GW of offshore wind projects throughout the APAC region.

Energy Storage

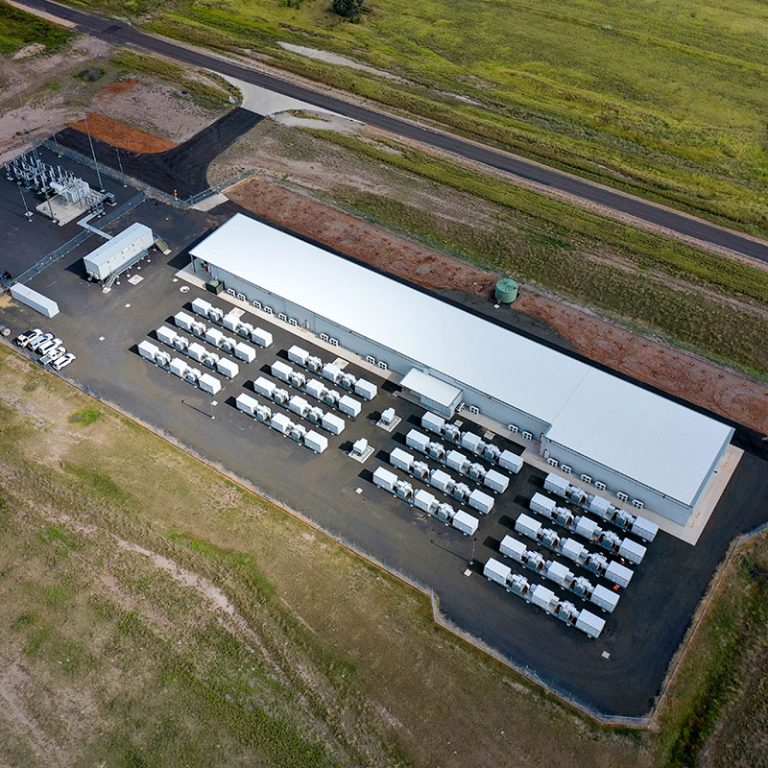
Energy storage is pivotal in the transition to renewable energy, enabling renewables to replace conventional power sources. As intermittent renewable energy such as solar and wind energy increase, energy storage systems manage fluctuations. Storage solutions store clean energy during low demand, dispatching it during peak times. With growing renewable installations and decreasing technology costs, stationary and portable storage, like batteries and green hydrogen, are poised for rapid commercial deployment.

VENA ENERGY BY THE NUMBERS

0 TWh
Clean electricity generated annually from renewable sources1
0 GW

Total portfolio capacity of onshore, offshore, and battery assets across Asia-Pacific2 

0 GW

Total construction and contracted capacity of onshore, offshore, and battery assets

0 GW

Total operational capacity of onshore, offshore, and battery assets

0

Employees across 86 corporate and site offices in the Asia-Pacific

ENVIRONMENTAL IMPACT METRICS as of 1H 2023

0
Households
Powered3
0
Greenhouse Gas Emission Reductions in Tonnes4
0
Water Saved
in Megalitres5
0
Equivalent Cars Removed from the Road6
0
Equivalent Trees Planted7

Notes

  1. As of December 2023, our operational capacity stands at 3.2 GW and the energy generation arising from those assets was 4.5 TWh.
  2. Megawatts (MWs) indicate Gross Capacity of all Operational, Construction, Contracted and Development assets as of FY2023.
  3. Households Powered is based on annual household electricity consumption of each operating country derived from Residential Electricity Consumption data obtained from the International Energy Agency (2020) and number of households data derived from population data from United Nations (2022) and household size data taken from United Nations (2022) and Statista database (2021).
  4. Greenhouse Gas (GHG) Emissions Reduction is calculated assuming that the generation from renewable energy plants replaces an equal quantity of electricity generated using coal, gas and oil. Unique GHG emissions factors were calculated for each country based on each country’s GHG emissions factor published on the UNFCCC Harmonized IFI Default Grid Factors 2021 v3.2.
  5. Water Saved is calculated based on the water consumption of solar and wind power plants compared against the various sources of power generation in each country where Vena Energy operates in. Unique water savings factors were calculated for each country based on respective country energy mix obtained from International Energy Agency (2020-21) and water use intensity factors from a paper titled “Water Demand Scenarios for Electricity Generation at the Global and Regional Levels” by Terrapon-Pfaff, et al., (2020).
  6. Equivalent Cars Removed from the Road is based on annual GHG emissions of passenger vehicles obtained from the United States Environmental Protection Agency, last updated: April 2023.
  7. Equivalent Trees Planted is based on the amount of GHG sequestered by a medium growth coniferous or deciduous tree, planted in an urban setting and allowed to grow for 10 years, data obtained from the United States Environmental Protection Agency website, last updated: April 2023.